 |
Experiment 3: Curious Queue Behaviour Under Heavy TrafficAhmet Sekercioglu and Leon Seng |
Objectives
In this experiment, we will be observing the behaviour of a queue under heavy load. We will be modeling an output queued packet switch (with only one port) as such:
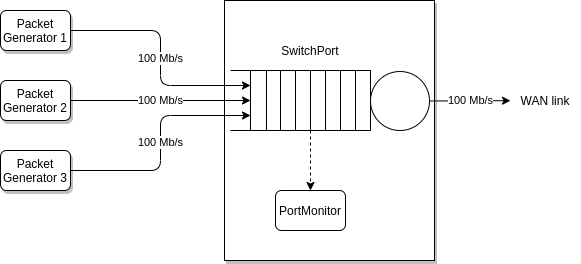
Each packet generator modeling the aggregate behaviour of a number of hosts attached to a LAN switch, which in turn is connected to a router for Internet access. Each link has a speed of 100 Mb/s (Megabits per second), which can be intepreted as 100,000 Kb/s or 100,000,000 b/s.
Experiment:
Part 1
In this section, we will observe the behaviour of the queue length under increasing load. The Python script below represents the model detailed above, but with only one packet generator (id = LAN1).
# lan_to_wan.py: Last modified on 22 Apr 2020.
from random import expovariate
import functools
import simpy

from SimComponents import PacketGenerator, PacketSink, SwitchPort, PortMonitor

def run_sim():
    # Create the SimPy environment
    env = simpy.Environment()

    # Our simulation componentns
    ps = PacketSink(env, debug=True) # debug: every packet arrival is printed
    pg = PacketGenerator(env, "LAN1",
        adist=functools.partial(expovariate, 1/1.5),
        sdist=functools.partial(expovariate, 1/100)
    )
    switch_port = SwitchPort(env, rate=100e6)

    # We use a PortMonitor to track queue sizes over time
    # See SimComponents.py
    sample_dist = lambda : 1.0
    pm = PortMonitor(env, switch_port, dist=sample_dist)

    # Wire the components together
    pg.out = switch_port
    switch_port.out = ps

    env.run(until=20)

if __name__ == '__main__':
    run_sim()
Go through the provided Python script and understand how the model is put together. It uses Dr. Bernstein's SimComponents.py. It would be a good idea to check out the contents of the SimComponents.py to find out more about the implementation of the simulated elements.
Note: When defining the SimComponents.PacketGenerator, we use the Python functools module to slightly ease the definition of functions returning a random sample with a given parameter. This is equivalent to defining the distribution function as below:
from random import expovariate

# equivalent to functools.partial(expovariate, 1/1.5)
def arrival_dist():
    return expovariate(1/1.5)
Once you understand how the model is built, go through the following steps:
Configure your packet generator to use exponentially packet size distribution with an average packet size of 300 bytes.
Calculate and configure the packet inter-arrival times for the packet generator to keep the WAN link busy for 10% of the time. You can use a constant value for this. Hint: If we have packets of constant size 100 bytes generated with a constant inter-arrival time of 1.5 seconds, that gives an average arrival rate of about 533.3 bits/s.
Run your simulation for 600 seconds and record the average queue length. Once the simulation has been completed, have the script calculate the average queue length into a CSV file.
Repeat the steps above for the following link loads: 10%, 20%, 30% … 90%, 99%
Finally, using matplotlib.pyplot.plot, plot a graph of average queue length against the WAN link load.
Show the output to your lab demonstrator.
Part 2
Next, we will observe the fairness of a first in, first out (FIFO) switch buffer.
Modify the script by adding 2 more packet generators (ID = LAN2 and ID = LAN3) connected to the same switch port. The generators should be all be configured with the inter-arrival distribution you used in Part 1, but with a link load of 20%. Each switch port should have the following average packet size
LAN1: 300 bytes
LAN2: 100 bytes
LAN3: 500 bytes
Run your simulation for 600 seconds and record how many bytes each packet generator has been able to send. Comment on the results.
Your Report
After finishing your experiments, you will need to prepare a short (maximum two pages, 10 pt Times-Roman font) report summarizing the key points you have learned in this exercise.
Please convert your report to PDF (no other formats will be accepted), zip your report with all the Python code you have written for the experiment, and upload all as a single zip file to the unit's Moodle site before the due date (we will post the deadlines at the unit's Moodle site).
References
https:www.grotto-networking.com/DiscreteEventPython.html